|
|
|
| This document is available in: English Castellano Deutsch Francais Italiano Nederlands Portugues Indonesian Russian Turkce |
![[Photo of the Author]](../../common/images2/MarioMKnopf.jpg)
by Mario M. Knopf (homepage) About the author: Mario enjoys to keep busy with Linux, networks and other topics concerning security related issues. Translated to English by: Mario M. Knopf (homepage) Content: |
darkstat - a network traffic analyzer![[Illustration]](../../common/images2/article346/darkstat.jpg)
Abstract:
This article presents the network traffic analyzer
"darkstat" and gives an overview concerning
installation, start and usage of this program.
|
"darkstat" [1] is a network monitoring tool, which analyses the resulting traffic of a network and generates on the basis of these data miscellaneous statistics as HTML-Output. These statistics can be viewed comfortably in a browser. For this purpose the author of the program, Emil Mikulic, had "ntop" [2] in use for a long time. But he was disaffected of its stability issues and its bad memory behavior. For this reason he developed "darkstat". The addressed statistics refer of the communication between hosts, the caused traffic and the used port numbers alternatively the involved transmission protocols. Additionally diagrams to the collected time periods and a short summary of the analyzed packets since program start can be regarded.
The sources of the program "darkstat" can be referred directly under [3]. Alternatively also one of the two mirrors can be visited at [4] and [5]. If someone looks for Debian packages, he finds these under [6].
"darkstat" also depends, like a lot of other network monitoring tools, on the "libpcap"-file [7]. This is a library, which is used by packet sniffers and provides them an interface to capture and analyze packets from network devices. To install "darkstat" you need therefore this library.
Then you have to compile it with the well-known three-set "./configure && make && make install". It is important, that the last instruction must be done with root-rights.
"darkstat" offers some parameters, which can be set at program start. However, for a first test a start without any options is enough. In order to be able to perform the work, however the program has to be started as root or with "sudo"-privileges [8]:
neo5k@proteus> sudo /usr/local/sbin/darkstat

We trust you have received the usual lecture from the local System Administrator.
It usually boils down to these two things:

#1) Respect the privacy of others.
#2) Think before you type.

Password:
After the authorized user has entered his password, "darkstat" starts and prints various status messages:
darkstat v2.6 using libpcap v2.4 (i686-pc-linux-gnu)
Firing up threads...
Sniffing on device eth0, local IP is 192.168.1.1
DNS: Thread is awake.
WWW: Thread is awake and awaiting connections.
WWW: You are using the English language version.
GRAPH: Starting at 8 secs, 51 mins, 22hrs, 30 days.
Can't load db from darkstat.db, starting from scratch.
ACCT: Capturing traffic...
Point your browser at http://localhost:666/ to see the stats.
Since the test was successful and the output is self-describing, we can look at the possible start parameters.
As previously mentioned, "darkstat" provides several options, which can be simply be provided during the startup. Those parameters are:
With option "-i" you can specify which interface is monitored.
darkstat -i eth1
Started without special parameters, "darkstat" opens the privileged port 666. You can prevent this habit, when you start it with parameter "-p":
darkstat -p 8080
In order to bind a certain port to a specific interface, you can use the option "-b". In the following example to the local loopback address:
darkstat -b 127.0.0.1
Persistent DNS-Resolution can be prevented by the parameter "-n". This may be good for people without a flatrate or a dedicated line.
darkstat -n
Use option "-P" to prevent "darkstat" from putting the interface into "promiscuous mode". However, this is not recommendable, because "darkstat" only captures and analyzes the packets, which are addressed to the MAC of the monitored network interface. All other packages are rejected.
darkstat -P
Parameter "-l" activates correctly "SNAT"-behavior in the local network. "SNAT" stands for "Source Network Address Translation" and means that your router masks the local IP address of the client with its own public. Thus he sends the inquiry representatively for the originally inquire client.
darkstat -l 192.168.1.0/255.255.255.0
With parameter "-e" you can perform a packet filter expression.
darkstat -e "port not 22"
From version 2.5 upwards you can detach "darkstat" from the starting terminal. Thus it works like a daemon.
darkstat --detach
Via parameter "-d" you can specify the directory where "darkstat" creates its database.
darkstat -d /directory
Option "-v" activates the "verbose mode":
darkstat -v
If you are interested in the version number of "darkstat" or its full usage and syntax, try parameter "-h".
darkstat -h
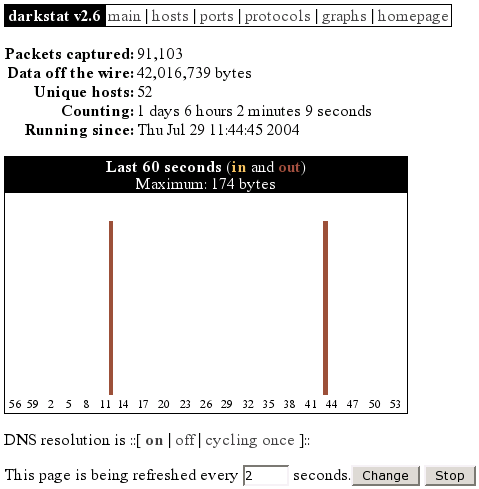
After the first start of "darkstat" you can point your browser to "http://localhost:666/", which is the default. Now you can look at a short summary of the statistics and a few graphs generated since program start:
At the "hosts" site you can see all the machines which take part in the communication. These can be arranged by the caused traffic or their particular IP address. By this possibility you can detect the machines, which have produced the highest traffic in the local network, very fast. Thereby the responsible system administrator has a chance to get to the bottom of a problem. For example, in the following screen shot this would be the client with the local IP address "192.168.1.203".
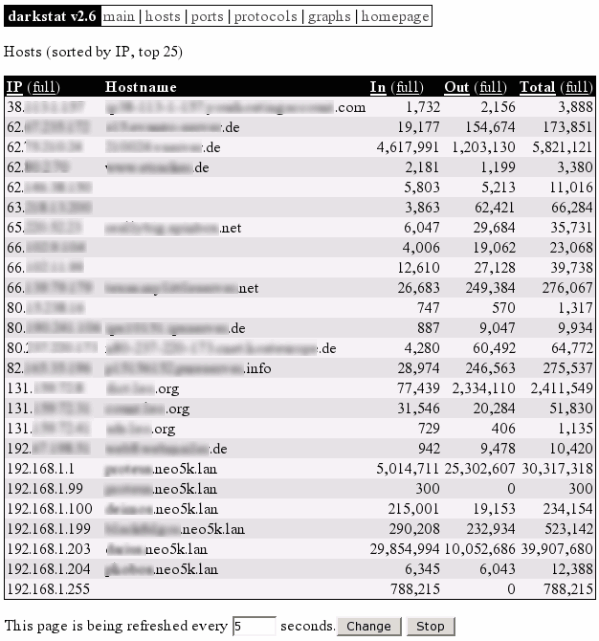
Illustration 2: darkstat hosts
In illustration 3 you can see the port numbers which are used by server and client applications. You can immediately recognize the port numbers which are used by the following daemons: 21 (FTP), 22 (SSH), 139 (Samba), 631 (CUPS), 666 (darkstat), 3128 (Squid). However, the two services "dhcpd" and "dnsmasq" aren't visible, because these services communicate via "UDP". All other ports larger than 1024 are not privileged and were used by client applications for communication. The proxy server "squid" represents a exception, because it uses the port 3128 as default setting. You can view a maintained list of all port numbers on IANA [9], which is responsible for these. Alternatively you can look into the file "/etc/services".
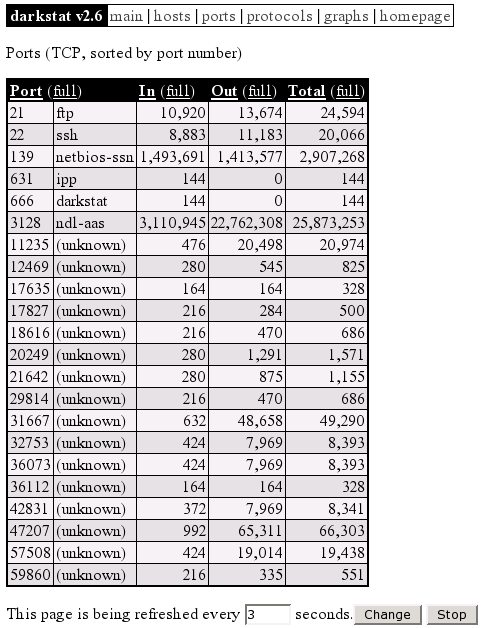
Illustration 3: darkstat ports
In the following picture you can see the protocols "ICMP", "TCP" and "UDP" for the file transmission, which were involved in the communication event. If someone is interested in these protocols, he will find good introductions in the following RFCs on [10], [11] and [12].
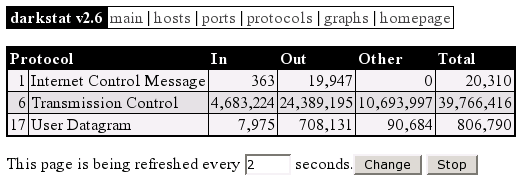
Illustration 4: darkstat protocols
The last screen shot shows a summary of the collected time periods as graphs:
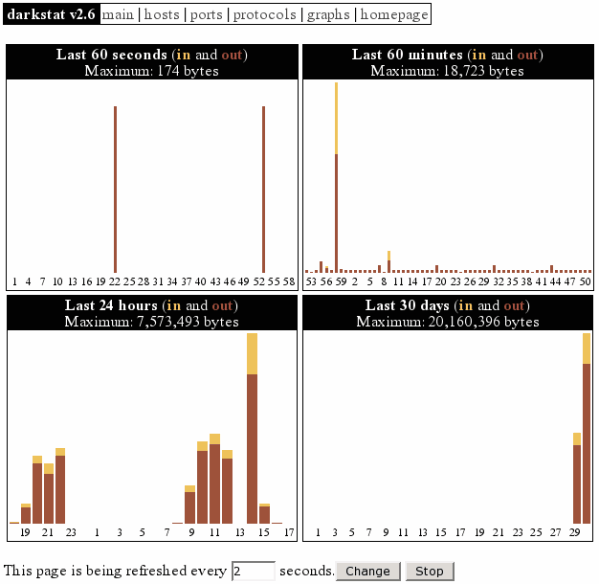
Illustration 5: darkstat graphs
The version 2.6 of "darkstat" about which we discussed here, is unfortunately dependent on "pthreads". This causes problems on other platforms (e.g. NetBSD). For this reason the program author Emil Mikulic decided to not develop the current version 2.x any further and works instead already on 3.x.
In the new version things are being implemented like capturing packets from multiple interfaces simultaneously, a config file parser, an optically improved output for diagrams (comparably with the RRDtool [13]), a customizable CSS-file, admin login and editing of the database through the web interface etc.
"darkstat" is a very stable and fast network monitoring tool, which exclusively serves its targeted purpose - to analyse traffic. Furthermore it works without any problems, stands in constant development and will have many new and interesting features in the upcoming version. So long I wish much success with the search for "traffic sinners" in your local networks.
[1] http://purl.org/net/darkstat [Home of darkstat]
[2] http://www.ntop.org/ [Home of ntop]
[3] http://dmr.ath.cx/net/darkstat/darkstat-2.6.tar.gz
[Download]
[4] http://yallara.cs.rmit.edu.au/~emikulic/_/darkstat-2.6.tar.gz
[Download Mirror #1]
[5] http://neo5k.de/downloads/files/darkstat-2.6.tar.gz
[Download Mirror #2]
[6] http://ftp.debian.org/debian/pool/main/d/darkstat/
[Debian Packages]
[7] http://www.tcpdump.org/ [Home of libpcap]
[8] http://www.courtesan.com/sudo/ [Home of sudo]
[9] http://www.iana.org/assignments/port-numbers
[IANA Port-Numbers]
[10] ftp://ftp.rfc-editor.org/in-notes/rfc792.txt
[RFC 792 - ICMP]
[11] ftp://ftp.rfc-editor.org/in-notes/rfc793.txt
[RFC 793 - TCP]
[12] ftp://ftp.rfc-editor.org/in-notes/rfc768.txt
[RFC 768 - UDP]
[13] http://people.ee.ethz.ch/~oetiker/webtools/rrdtool/
[Home of RRDtool]
|
Webpages maintained by the LinuxFocus Editor team
© Mario M. Knopf "some rights reserved" see linuxfocus.org/license/ http://www.LinuxFocus.org |
Translation information:
|
2004-10-15, generated by lfparser version 2.50